Using geological assessments and analyses, probabilistic models are created to understand and predict the likelihood of weather events occurring over time. Typical time frames are 100-year or 500-year events, but can be for any length of time. Risks are then assessed for consideration of such undertakings as insurance, construction, levees, and mortgages.
In the case of the tragic flooding of the Guadalupe River near Hunt, Texas, we are not certain of its exact historical flooding record since the first flood was only recorded and registered in 1838, some 187 years ago, but the record is long and incessant. The river crested at 31½ feet in 1987, or higher by 1½ feet from the most recent flooding.
The Guadalupe River has experienced major recorded floods in various years, including 1838, 1848, 1868, 1872, 1906, 1921, 1936, 1952, 1972, 1973, 1978, 1987, 1989, 1991, 1997, 1998, 2015, 2018, 2020, and 2021 and the recent one in July of 2025.
Despite, central Texas being recognized as one of the most flood-prone areas in the US, the climate hawks were immediately blaming anthropogenic climate change on the event, and secondarily, President Trump’s position on climate change and cuts to the federal government workforce.
However, according to Chris Moss’ meteorological website, the National Weather Service issued sufficient flood advisories and warnings, but they were not heeded or, alternatively, not heard. They need a better alarm system in that area, especially where cell coverage is poor, or disallowed - example, the Mystic children’s camp.
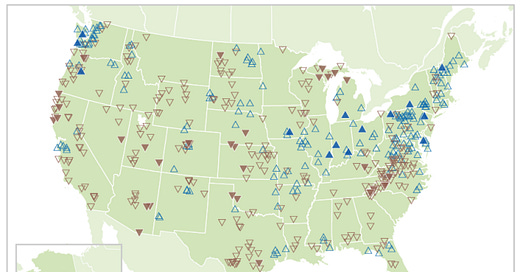
The following EPA map illustrates, “Change in the Magnitude of River Flooding in the United States, 1965–2015”:
The description underneath states, “This figure shows changes in the size of flooding events in rivers and streams in the United States between 1965 and 2015. Blue upward-pointing symbols show locations where floods have become larger; brown downward-pointing symbols show locations where floods have become smaller. The larger, solid-color symbols represent stations where the change was statistically significant.”
You will note that while down-pointing brown arrows, which indicate a decrease in flooding, are much more visible on the map as a whole, in central Texas, blue is essentially non-existent indicating there has been a general decrease in flooding.
Rainmaker Technology Corporation performed cloud seeding on July 2, just two days before the flood event. While they say this was a minor seeding, and it may have been inconsequential to the flooding, Augustus Doricko, CEO of that company, was on NBC News, citing that although they manipulate the weather, it was the long-term human-induced climate change that created all the damage. Doricko claimed that the burning of fossil fuels is causing the climate to change, and this, from a physics standpoint of basic science that has been recognized since 1820. Like all carbon dioxide creators, especially from aircraft, his CO2 footprint is negated by his virtuous attitude.
But the event is being exploited politically, and loudly, by the climate change campaigners, rather than as a tragic event where human lives were lost. While I don’t want to take away from the devastation and suffering of many families and friends, the climate crusaders just cannot help themselves.


Yet, everything is not as it seems. Saturation rates there are very poor, and campsites need to be reconstructed on higher ground and a loud alarm system set in place. Rainfall consisted of a mixture of inland rain and incoming rain from the Gulf. This can happen from time to time, as is obvious from the river's history of flooding.
Good info, a very dangerous place to go camping! 31 feet in an hour of rain. That's crazy!